
Monitoring SDG 4
UNICEF/Nader
TARGET 4.1. PRIMARY AND SECONDARY EDUCATION
In 2022, the UIS and the GEM Report developed a new model to estimate the out-of-school rate, combining multiple data sources. It put the global out-of-school population of primary and secondary school age at 244 million in 2021, 9 million less than in 2015. The decline amounts to a slow decrease in the out-of-school rate, just over 0.2 percentage points per year. Over the same period, the out-of-school population in sub-Saharan Africa grew by 12 million despite a decline in the out-of-school rate of 0.1 percentage points per year (Figure 3). This is the result of rapid demographic growth, with the school-age population growing by 50 million in just 6 years.
Figure 3: The out-of-school population in sub-Saharan Africa increased by 12 million over 2015–21
In-school and out-of-school population and out-of-school rate, sub-Saharan Africa, 2000–21
Source: UIS and GEM Report estimates based on the out-of-school rate model.
However, the monitoring of progress has been hampered by the COVID-19 pandemic, which disrupted data collection. The out-of-school rate model may not be sensitive enough to capture a short-term impact such as that of COVID-19. Between 2019 and 2021, the UIS database has data for one in four countries on primary education and one in five on secondary education. Excluding India and the Philippines, which reported the largest decrease and largest increase in their out-of-school population, respectively, the data suggest no visible impact in primary and lower secondary education but an increase of just over half a million in the population of upper secondary youth out of school. These data also show that the longer the duration of school closures, the higher the increase in out-of-school rates.
Global completion rates increased between 2015 and 2021 from 85% to 87% in primary, from 74% to 77% in lower secondary and from 54% to 59% in upper secondary education. Sub-Saharan Africa remains well below the global average, by more than 20 percentage points in primary (64%) and by almost 30 points in lower secondary (45%) and upper secondary education (27%).
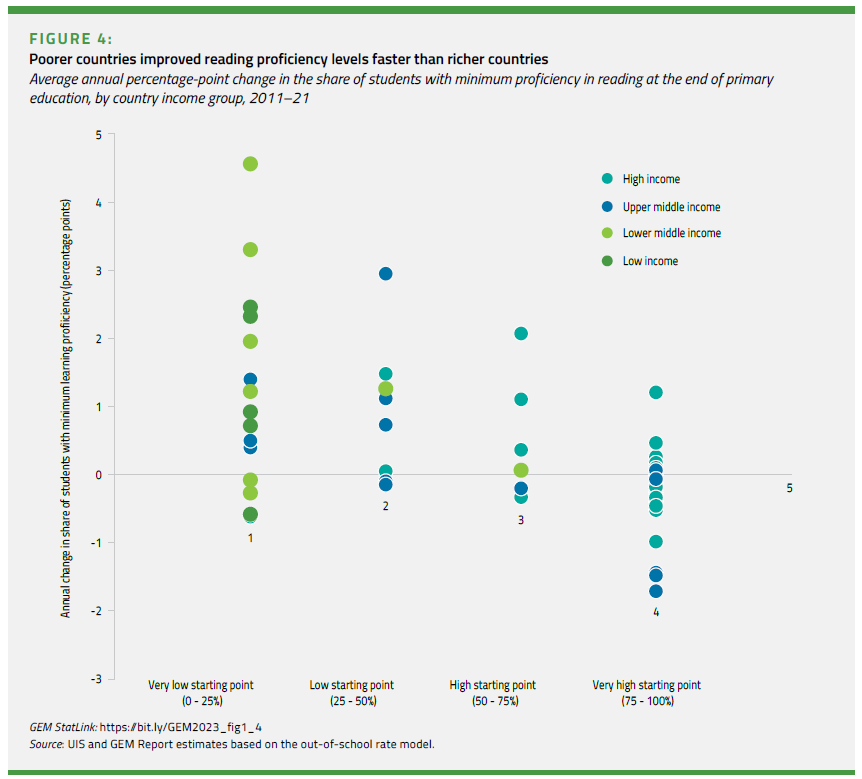
Of the 31 low- and lower-income countries for which there are data since 2019, only Viet Nam has a majority of children achieving minimum proficiency in both reading and mathematics at the end of primary school. In 18 of the countries, less than 10% of children reach minimum proficiency in reading and/or mathematics. For every child to achieve minimum learning proficiency by 2030, average annual progress must reach at least 2.7 percentage points, well above the average of 0.4 percentage points observed in 2000–19. Trend data remain scarce: There are only 13 low- and lower-income countries with two observations since 2013. Moreover, the quality of the trend data is sometimes not sufficient enough to allow robust assessment of change over time. But available evidence suggests that, since 2011, the share of students at the end of primary education with minimum proficiency in reading has increased faster in low- and lower-middle-income countries (by 0.71 percentage points per year), albeit from lower starting points, than in upper-middle- and high-income countries (where the share has fallen by 0.06 percentage points) (Figure 4).
Major concerns remain about the impact of COVID-19 on learning outcomes. The first robust piece of cross-national evidence is the 2021 Progress in International Reading Literacy Study (PIRLS) on grade 4 students, whose results were released in May 2023. Students from 57 mostly upper-middle- and high-income countries participated. Progress relative to 2016 could be assessed for 32 of the countries. In one way, the 2021 PIRLS seems to confirm that COVID-19 had a negative impact on learning: 21 of 32 countries performed worse in 2021 than in 2016, while 8 retained the same levels and 3 improved. But another way to interpret the results is that they are not as bad as they might have been. In 10 of the 21 countries whose achievement scores fell between 2016 and 2021, the scores also decreased between 2011 and 2016. And in absolute terms, the average decline in the PIRLS score between 2016 and 2021 was 8 points, which is about one fifth of what children learn in a school year, a small impact given the magnitude of the disruption.
Apart from PIRLS, several country-specific studies have been published. However, they are not anchored to the SDG 4 global proficiency level, and comparability is further hampered by the studies being carried out at different times, levels and subjects. While high-income countries, such as those that took part in PIRLS, experienced a far smaller impact or sometimes none, low- and middle-income countries, with longer school closures and fewer learning continuity opportunities, appear to have suffered a stronger impact. Findings from Brazil, Cambodia, Malawi and Mexico suggest children lost at least one year of learning. The longer schools stayed closed, the stronger the impact on learning losses.
TARGET 4.2. EARLY CHILDHOOD
Globally, the early childhood education participation rate remained stable at about 75% between 2015 and 2020. The largest increases, of about four percentage points each, took place in sub-Saharan Africa and in Northern Africa and Western Asia, the two regions with the lowest baseline values, which reached 48% and 52%, respectively.
About three quarters of countries still lack compulsory pre-primary education and half do not offer free provision. In 2022, 88 out of 186 countries with data for both did not have legislation committing to either free or compulsory pre-primary education. This matters because countries that guarantee free and compulsory pre-primary education tend to have higher enrolment rates. On average, the enrolment rate for children one year younger than the official primary entry age in countries that do not offer free pre-primary education is 68%, compared with 78% among those that guarantee one year free and 83% among those that guarantee at least two years.
COVID-19 caused sharp declines in pre-primary participation in many countries, across income groups (Figure 5). But the effect was not consistent globally. Out of 127 countries with available data, 54 saw a decline in participation in either 2020 or 2021. Participation was relatively stable in 30 countries and increased in 43 over the period. More data are needed to confirm the pandemic’s impact on participation, as some observed changes could be due to challenges related to data collection during school closures.
Figure 5: In some countries, early childhood education participation rates dropped drastically during the pandemic
Participation rate in organized learning one year before the official primary entry age, selected countries, 2010–22
Source: UIS database.
The new Early Childhood Development Index, which assesses the interrelated domains of learning, psychosocial well-being and health, highlights significant inequality in development between children of different backgrounds. In Nigeria, for example, nearly 80% of children whose mother has a tertiary education are developmentally on track, but the same is true for only 31% of those whose mother has not completed primary school.
TARGET 4.3. TECHNICAL, VOCATIONAL, TERTIARY AND ADULT EDUCATION
TARGET 4.4. SKILLS FOR WORK
There is a shortfall of ICT skills. Globally, 4% of adults aged 15 and above can write a computer program using a specialized programming language. Prior education is a strong predictor of the likelihood that youth and adults have achieved at least a minimum level of proficiency in digital literacy skills. In 31 countries with data, those with tertiary education are almost twice as likely to have basic digital skills as those with less education. There is also a generational gap: Younger adults are at least twice as likely to have basic digital skills as older adults.
Globally, the supply of STEM graduates has remained remarkably stable since 2000. The share of graduates in digital technology subjects has grown slowly if at all, as have the shares in scientific and applied STEM subjects. Digital technology graduates make up around 5% of the total, science and mathematics graduates another 5%, and engineers a further 10–15%. Similar proportions of graduates in science, mathematics and digital technology are observed across country income groups, with a difference of just one percentage point between low-income and high-income countries in each case. But around 12% of students graduate in engineering in high-income countries, compared with 7% in low-income countries.
TARGET 4.5. EQUITY
In recent decades, progress on girls’ education access and completion has been one of the main achievements in equality in education. Across education levels, all regions have achieved gender parity in education except sub-Saharan Africa, where there are 90 girls enrolled for every 100 boys. These aggregates mask higher levels of gender disparity in some countries. For example, in Chad, the number of girls enrolled for every 100 boys increased from 45 in 2015 to 58 in 2021; in Guinea, it increased from 65 in 2015 to 72 in 2020.
Regarding learning, UIS analysis suggests girls’ learning has improved faster over time than that of boys. Among students assessed in reading at the end of primary education, the average annual progress for girls globally since 2000 was 0.16 percentage points, compared with 0.12 percentage points for boys. Girls almost consistently outperform boys in reading. Globally, for every 100 proficient boys, 115 girls are proficient in reading at the end of lower secondary education. In 90% of countries with data, girls outperform boys in reading at the end of primary school. They do so in all countries at the end of lower secondary education.
The COVID-19 crisis exacerbated education inequality: Learning losses tended to be higher among poorer students, who benefited less from remote learning. In the Netherlands, the learning loss was 60% higher for students with less educated parents. In Pakistan, citizen-led assessment data on 5- to 16-year-olds in rural districts suggested that the reading gender gap reversed between 2019 and 2021 from favouring girls (18% boys vs 21% girls) to favouring boys (16% boys vs 14% girls).
A disadvantaged group that is not explicitly mentioned in the SDG 4 framework is first-generation learners, i.e. the first in their family to attend a particular level of schooling. Completing a level of education that your parents did not is a formidable challenge, whether for schoolgoing children of illiterate parents in poor countries or university students of less educated parents in rich countries. The median relative gap in primary completion by first-generation status in low- and lower-middle-income countries is 23 percentage points; it exceeds 40 points in Cameroon and Nigeria, a gap even larger than the urban–rural gap. The median gap in lower secondary completion by first-generation status is 34 percentage points; it reaches almost 50 points in Madagascar.
TARGET 4.6. YOUTH AND ADULT LITERACY
A literacy rate indicator based on direct assessment and recognizing multiple levels of proficiency was introduced in the SDG 4 monitoring framework to capture the evolution of thinking over what it means to be literate, as well as to motivate countries to invest in literacy assessments. However, the high cost of assessment, weak implementation capacity and insufficient demand means few upper-middle- and high-income countries have carried out such assessments since 2015. As a result, monitoring literacy has reverted to the traditional binary assessment of literate vs non-literate.
The youth literacy rate worldwide increased from 87% in 2000 to 91% in 2016, then plateaued. In sub-Saharan Africa and in Central and Southern Asia, literacy rates are below the global average, at 77% and 90%, respectively. The adult literacy rate reached 87% in 2016 and has also stagnated since. Among people older than 65, literacy rates improved fastest in Eastern and South-Eastern Asia, from 60% in 2000 to 84% in 2020.
Literacy is linked to significant development outcomes. For example, the gap in modern contraceptive use in urban Palestine between literate and illiterate women is 35 percentage points in urban areas and 22 percentage points in rural areas. In Fiji, the gap is around 12 percentage points in urban areas and 6 percentage points in rural areas.
The Programme for the International Assessment of Adult Competencies was carried out in three rounds in the 2010s in 37 upper-middle- and high-income countries. It is the only cross-national survey to both recognize various adult skills proficiency levels and assess numeracy. Less than half of adults in upper-middleincome countries that took part in the second (2015) and third (2017) rounds had minimum proficiency in numeracy, including in Ecuador (23%), Peru (25%), Mexico (40%) and Türkiye (49%). The only upper-middle-income country where the majority of adults had at least minimum numeracy skills was Kazakhstan (73%).
TARGET 4.7. SUSTAINABLE DEVELOPMENT AND GLOBAL CITIZENSHIP
Monitoring of progress in mainstreaming global citizenship education and education for sustainable development in policies, curricula, teacher education and assessment has been based on a self-reporting mechanism on implementation of the 1974 Recommendation concerning Education for International Understanding, Cooperation and Peace and Education relating to Human Rights and Fundamental Freedoms. Reporting has taken place every five years. A UNESCO-led process aims to supersede the text with a new recommendation reflecting contemporary needs. The proposed new text includes, for the first time, a section on follow-up and review, which gives guidance on actions that can be taken to monitor the implementation of the recommendation and learn from best practices. However, neither the Recommendation itself nor the guidance included in the follow-up and review section would be binding on any party.
Climate change education was a discussion focus at the UN Transforming Education Summit in September 2022 in New York. An initiative supported by UNESCO aims to introduce an indicator on prioritization and integration of green content in national curricular frameworks, and in the syllabuses of selected science and social science subjects, to measure the extent to which sustainability, climate change and environmental themes are covered in primary and secondary education. A collection of official documents is being assembled for about 100 countries and the first results are to be released in early 2024.
Another initiative, a collaboration between the GEM Report and the Monitoring and Evaluating Climate Communication and Education project, is collecting information on laws and policies in 70 countries to support peer learning on climate change education and communication. These profiles enable a comparison of countries’ progress in relation to Article 6 of the United Nations Framework Convention on Climate Change and Article 12 of the Paris Agreement, through Action for Climate Empowerment, and on SDG Target 4.7. Analysis of the first 50 profiles shows that 39% of countries have included climate change content in their education laws, and 63% of countries have included climate change in a law, policy or plan for teacher training.
TARGET 4.A. EDUCATION FACILITIES AND LEARNING ENVIRONMENTS
Safe, welcoming environments are essential for effective learning and should be available to all. An important issue for gender equity is the availability of separate bathrooms for males and females. Over 20% of primary schools in Central and Southern Asia and in Eastern and South-eastern Asia lack functional single-sex bathrooms, as do 94% in Togo and 83% in Mali. Globally, single-sex bathrooms are more common in upper secondary than in primary schools. In Niger, for example, the share of schools with single-sex bathrooms increases from 20% in primary to over 80% in upper secondary education. But this might be too late for some girls: A lack of menstrual hygiene facilities, stigma and stress lead many girls to miss up to one week of school a month, increasing their chances of falling behind and dropping out.
Electricity is another basic need, but it is still lacking in around one quarter of schools worldwide (Figure 6). The share of schools with electricity is lower than average in Central and Southern Asia and, especially, in sub-Saharan Africa, where it barely increased from 30% in 2015 to 32% in 2020. Dissemination of solar power can help accelerate school electrification. Among 31 countries where more than half of primary schools lack electricity, 28 have solar-power potential above the global average.
Figure 6: There has been hardly any progress in school electrification in sub-Saharan Africa
Without electricity, students and teachers cannot use ICT in schools. In a considerable share of countries, many schools have either only internet or only computers for pedagogical purposes. In most cases, the share of schools with computers exceeds that of schools with internet. In Turkmenistan, for example, nearly all primary schools have a computer, but only 31% have the internet. But in a few countries, the opposite is true. In Lebanon and Maldives, over 90% of schools are connected to the internet, but only around 70% have a computer.
Technological innovation has been contributing to school building construction and safety improvements. Adapted materials can help protect from natural disasters. Air cleaning and sound insulation systems can improve overall health and well-being. Geographical information systems help minimize commute times and organize better pickup locations. But conflict continues to threaten students and teachers both in and on their way to school. Attacks on education and military use of schools and universities increased in 2020–21 relative to 2018–19, notably in Mali and Myanmar.
TARGET 4.B. SCHOLARSHIPS
Target 4.b is one of the few for which 2020 had been set as a deadline. In 2020, over USD 4.4 billion was disbursed in the form of scholarships and imputed student costs, an increase of USD 1.3 billion since 2015. This contrasts with the previous five-year period, when scholarships and imputed student costs remained relatively stable. Over 75% of scholarships and imputed student costs are disbursed to middle-income countries; only 11% go to low-income countries. However, low-income countries have benefited the most from the overall increase in scholarships and imputed student costs disbursed since 2015.
Target 4.b aims particularly to support student mobility for those in ‘least developed countries, small island developing states and African countries’. Such countries have seen increased student mobility, albeit at a slower rate than the rest of the world. Globally, the number of outbound international students tripled between 2000 and 2020, whereas for sub-Saharan and Northern Africa it increased by about 2.2 times, and for small island developing states by about 1.5 times. By far the most common destination for students from these regions is North America and Western Europe, which accounts for nearly 60% of students.
TARGET 4.C. TEACHERS
Since 2015, progress on increasing the proportion of qualified teachers has been uneven across regions and education levels. The greatest improvement took place in sub-Saharan Africa, but the region still lags at all levels of education. At the pre-primary level, which had the lowest starting point, the share of qualified teachers increased from 53% in 2015 to 60% in 2020. In upper secondary education, it increased from 59% to 65%. Nevertheless, the region is far from achieving the 2030 benchmarks, based on countries’ own targets of reaching 84% in pre-primary, 92% in primary and lower secondary, and 89% in upper secondary education.
Teachers are often qualified but not trained, or trained but not qualified. In Lebanon, for example, 77% of primary school teachers have the minimum required academic qualifications but only 23% have the minimum pedagogical training. Interpreting and comparing such statistics, however, is not possible without knowing the minimum required academic and training qualifications in each country. In Uruguay, a teacher must complete a bachelor’s degree to teach in primary education, while in India an upper secondary certificate suffices. Comparing training requirements is arguably even harder, as there is no common international classification for training programmes. To address this knowledge gap, the UIS is developing the International Standard Classification of Teacher Training Programmes (ISCED-T), a framework to gather cross-nationally comparable statistics on teacher training programmes.
Efforts to increase the supply of qualified teachers must consider the significant issue of teacher attrition, which varies widely across countries and education levels. For instance, lower secondary teacher attrition is around 15% in both Rwanda and Sierra Leone, but in primary the level is 3% in Rwanda and 21% in Sierra Leone.
FINANCE
Public education expenditure accounts for 4.2% of gross domestic product (GDP) (ranging from 3.3% in Eastern and South-eastern Asia to 5.4% in Oceania) and 14.2% of total public expenditure (from 9.6% in Northern Africa and Western Asia to 16.5% in sub-Saharan Africa). High-income countries spend 1.3 percentage points of GDP more on education than low-income countries, while low-income countries allocate 4.4 percentage points more than high-income countries in total government spending on education.
The GEM Report has estimated that to achieve national SDG 4 targets for pre-primary, primary and secondary education in low- and lower-middle-income countries, there is an annual financing gap of USD 97 billion between 2023 and 2030. This gap represents 2.2% of GDP and 24% of the overall cost of education. The share of education spending on pre-primary and primary education would have to increase from around 40% of total spending in 2023 to 50% in 2030. These estimates do not include tertiary education, which would increase costs further.
A separate analysis for this report tried to calculate the cost of digital transformation, including digital learning, devices, electricity and internet connectivity. For low-income countries to achieve a limited level of digital learning and solar-powered electricity for all schools and for lower-middle-income countries to ensure fully internet-connected schools and higher availability of devices by 2030, these countries would need to devote USD 21 billion per year to capital expenditure between 2024 and 2030. In addition, the corresponding operational expenditure would have to increase by USD 12 billion per year. The combined cost would raise by 50% the annual financing gap these countries already face to reach their national SDG 4 benchmarks.
While OECD Development Assistance Committee members have committed to spend at least 0.7% of gross national income (GNI) on official development assistance (ODA), the actual level is about half that. It increased in 2022 from 0.33% to 0.36% of GNI in response to recent global events. Total aid to education decreased from USD 19.3 billion in 2020 to USD 17.8 billion in 2021. Aid to sub-Saharan Africa fell by 20%, from USD 5.6 billion to USD 4.5 billion.
The debt crisis in low-income countries has intensified in recent years. The International Monetary Fund has estimated that the number of countries either in debt distress or at high risk of it rose from 21% in 2013 to 58% in 2022 (Figure 7). This debt crisis poses similar challenges to that of the 1980s. Debt relief no longer plays a significant role in ODA, with its share declining since 2005. Some countries have used bilateral debt-for-development swaps as an alternative strategy to address debt burdens.
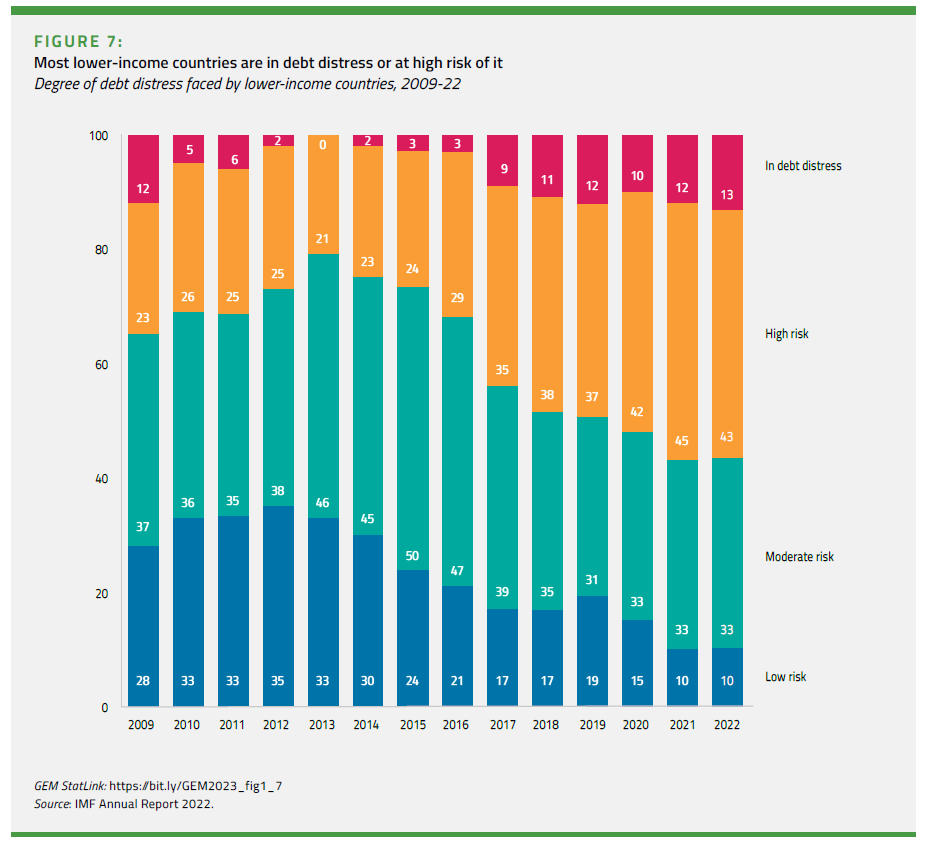
Image credits:

Chapter 12: UNICEF/Pouget
Chapter 13: UNICEF/Stephen/Infinity Images
Chapter 14: UNICEF/YPN
Chapter 15: UNICEF/Pirozzi
Chapter 16: UNICEF/Verweij
Chapter 17: UNICEF/Pirozzi
Chapter 18: UNICEF/Singh
Chapter 19: UNICEF
Chapter 20: UNICEF/Herwig
Chapter 21: UNICEF/Herwig
Chapter 22: UNICEF/Sokhin